
FIG. 4.
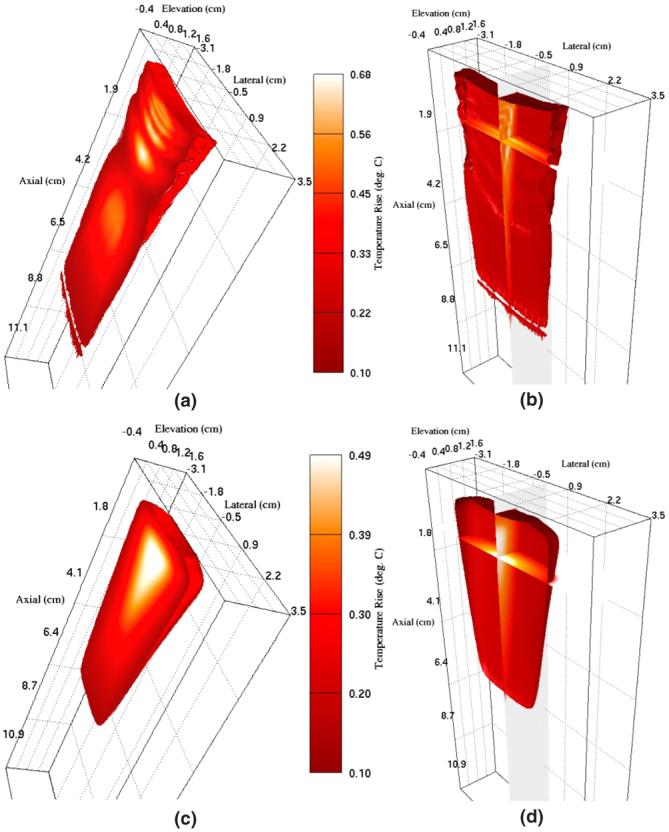
FEM simulation results showing the thermal response of hepatic tissue to a single ARFI imaging frame. (a) and (b) show results immediately following acquisition and (c) and (d) show results 15 s after acquisition. (a) and (c) show an isovolume of regions with temperatures elevated by at least 0.1 °C. (b) and (d) show isocontours of 0.1 °C as well as orthogonal slices through data.