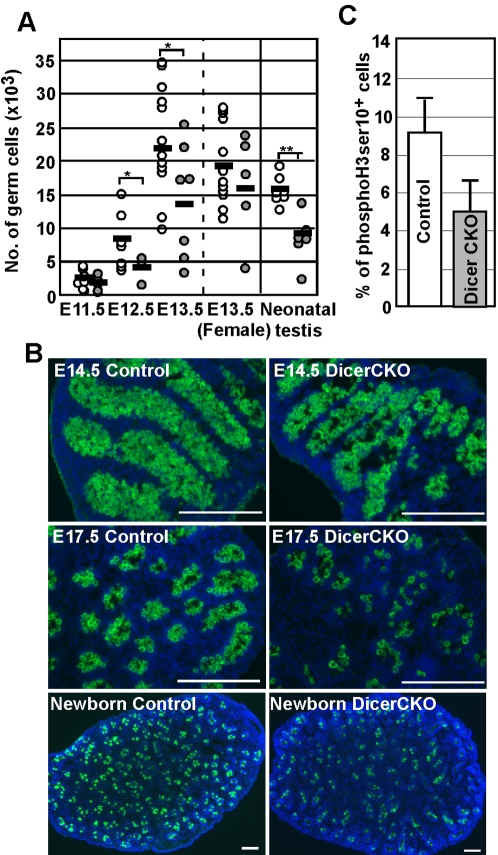
Figure 2. Defective proliferation of DicerCKO PGCs.
(A) The number of PGCs in E11.5∼E13.5 gonads and in neonatal testes. A single dot shows the number of PGCs or germ cells in a pair of gonads or testes (open circles; DicerF/+ TNAP-Cre, closed circles; DicerCKO). Black bar shows the mean. (B) Immunostaining for Mvh (green) in fetal and neonatal testis. The images are merged with DAPI (blue). Scale bar: 250 µm. (C) The reduced percentage of PGCs at M-phase in E12.5 DicerCKO male gonads. The percentages of PGCs immunostained for phosphorylated Ser10 of histone H3 are shown. Error bars represent standard deviation determined from three gonads.

