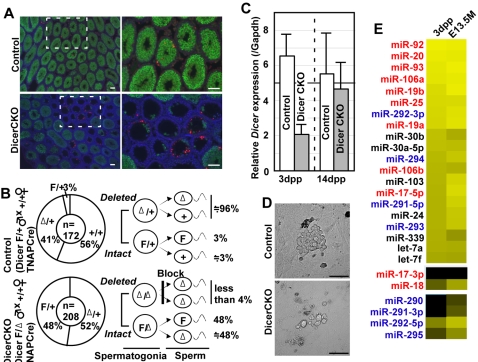
Figure 4. Crucial roles of Dicer on spermatogenesis.
(A) Immunofluorescence analysis for Mvh (green), apoptotic cells (red) and nuclei (blue) in 4 weeks-old DicerCKO testis. Right images show high magnification of white broken rectangles in left images. Scale bar: 50 µm (B) Biased inheritance of floxed dicer allele by progeny from DicerCKO males. Pie charts summerise percentages of genotypes of progeny from DicerF/+ TNAP-Cre (upper) and DicerCKO (bottom) males crossed with wild-type females. The number of progeny tested is shown in the center of the circles. Note that intact floxed dicer allele (F) is frequently inherited by progeny from DicerCKO males. Illustration in the right side of the pie charts estimates schematic ratio of Dicer excision in spermatogonia and spermatozoa, based on the percentages in the pie charts. Since floxed dicer allele is inherited by almost half of progeny from DicerCKO males, almost all fertile spermatozoa seems to be derived from DicerF/+ spermatogonia which had escaped from Dicer excision, indicating blockage of spermatogenesis of Dicer-deleted cells. (C) Expression levels of Dicer in neonatal spermatogonia and 14 dpp spermatocytes. Relative expression levels of Dicer were calculated by reference to the levels of Gapdh. (D) Representative colonies derived from neonatal testis after culture for 2 weeks. Scale bar; 50 µm (E) The list of miRNA highly expressed in neonatal spermatogonia. MiRNAs encoded in miR-17-92 and miR-290-295 clusters are marked with red and blue, respectively. The miRNA levels detected by real-time PCR are represented as a heat map. The intensity of yellow scale corresponds to the level of miRNA expression; black indicates that the signal below detection levels (see in Figure 1A).

