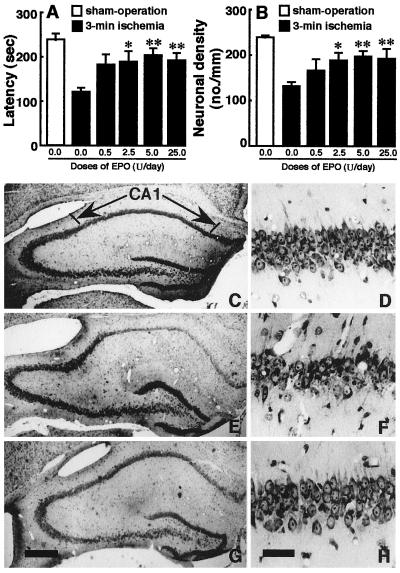
Figure 1.
Effects of intracerebroventricular EPO infusion on the response latency and hippocampal CA1 region of 3-min ischemic gerbils. (A) response latency; (B) CA1 neuronal density. Open columns indicate sham-operated (sham-op) animals and closed columns indicate vehicle- or EPO-infused ischemic animals. Each value represents mean ± SE (n = 8–11). *P < 0.05 and **P < 0.01, significantly different from the corresponding vehicle-infused ischemic group (statistical significance tested by the two-tailed Mann–Whitney U test). (C–H) Photomicrographs of hippocampal sections stained with cresyl violet: (C, E, and G) low magnification; (D, F and H) high magnification corresponding to C, E, and G. (C and D) A sham-operated animal; (E and F) an ischemic animal infused with vehicle; (G and H) an ischemic animal infused with 5 units/day of EPO. [Bar = 1.0 mm (C, E, and G) and 0.1 mm (D, F, and H).]

