
Figure 5.
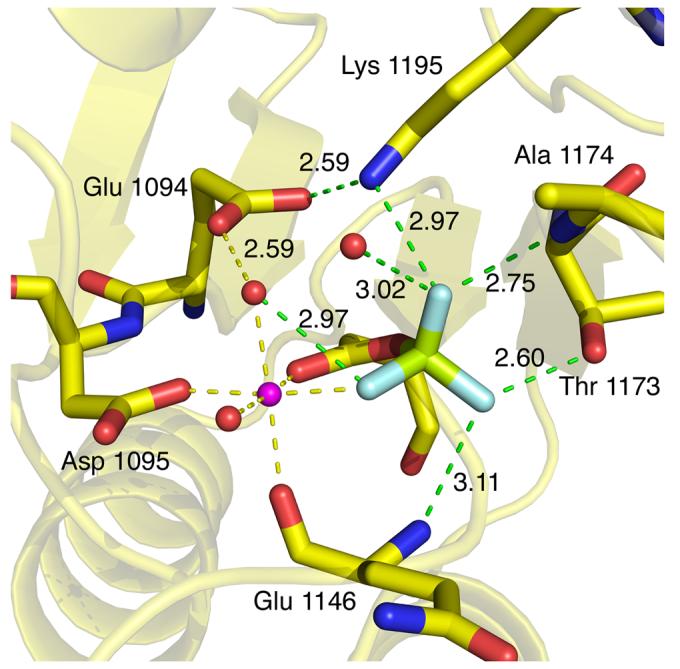
Close up view of the active site with important sidechains and distances labeled. SLN1-R1 carbons are yellow with oxygens and nitrogens colored red and blue, respectively; BeF3− is light green and light blue, Mg2+ is magenta, and waters are red. Mg2+ coordination bonds are shown in yellow and the distances range from 1.99 Å to 2.14 Å. Bonds to the BeF3− atoms are shown in green with the bond lengths indicated in angstroms.