
Fig. 3.
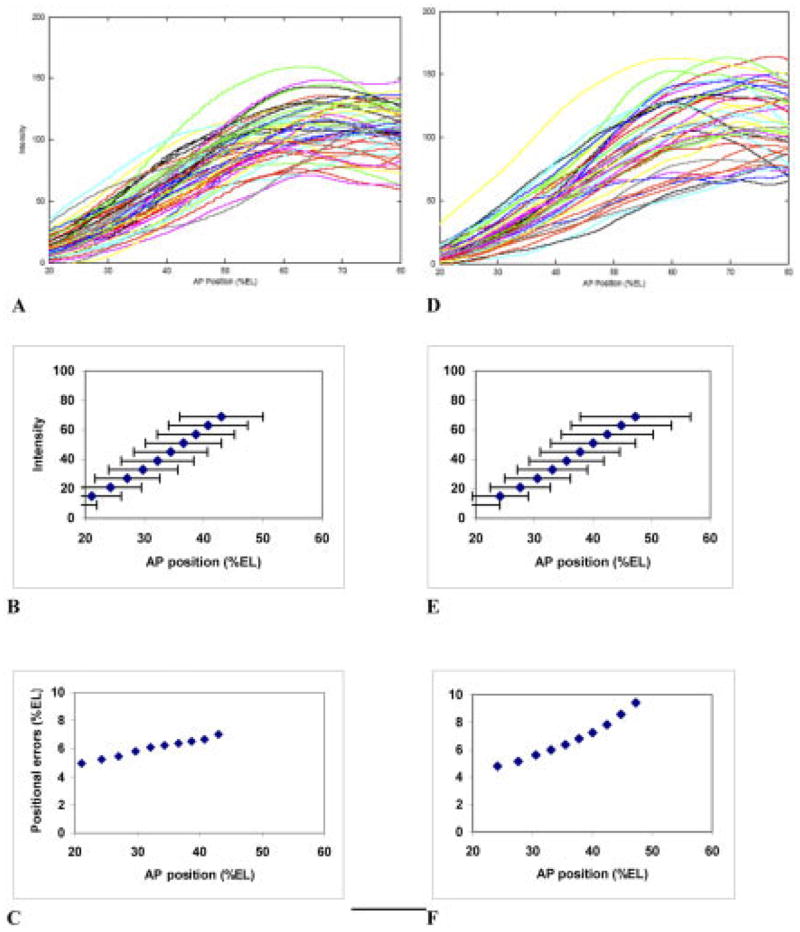
Overlay of Cad patterns, with summary statistics and trends. A–C: Cleavage cycle 13 pattern. A: Overlay of anteroposterior (AP) profiles, for 47 embryos. B: Mean positions, at select intensities, with one standard deviation error bars. C: Plot of these standard deviations against AP position. Like Bcd, Cad shows a rise in positional errors toward the posterior. D–F: Early cleavage cycle 14 (T1–2). D: Overlay of AP profiles, for 43 embryos. E: Mean positions, at select intensities, with one standard deviation error bars. F: Plot of these standard deviations against AP position. The posteriorly rising trend in positional errors increases from cycle 13. Bcd is a translational repressor of Cad: the change between C and F may reflect the sustained effects of Bcd’s greater variability toward the posterior.