
Fig. 6.
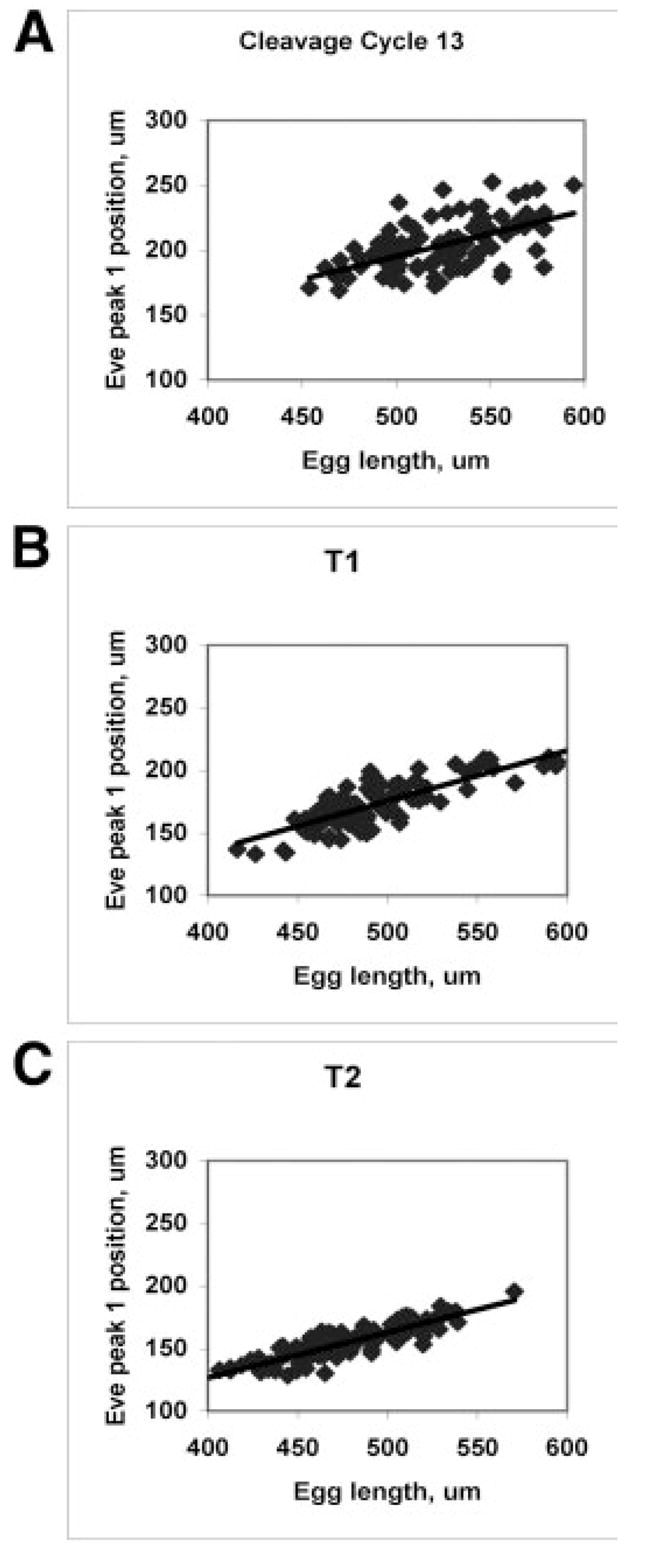
Eve position increasingly correlates with egg length (becomes more precise in relative units). A: Cycle 13, Eve peak 1 position vs. egg length (both in μm), R = 0.55. B: Cycle 14, T1, R = 0.81. C: Cycle 14, T2, R = 0.87. Scatterplots later in cycle 14 are comparable to T2.