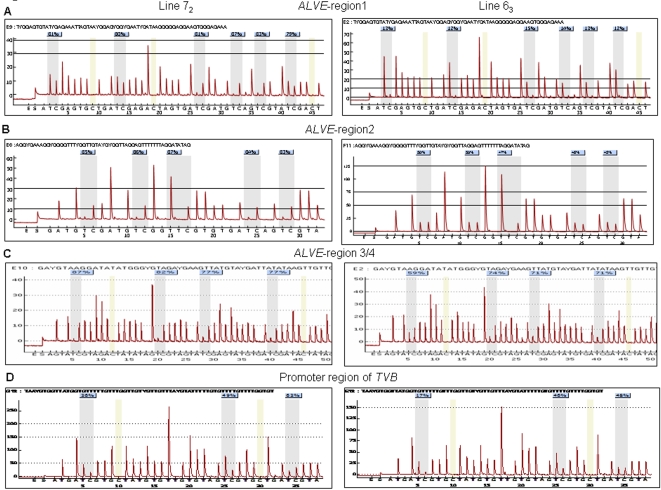
Figure 2. Representative pyrograms for each gene region in line 72 and 63.
The percentage on each CpG site is the methylation percentage of mC/(mC+C) on this site. mC: methylated cytosine, C: unmethylated cytosine. The sequence above the peak is the sequence to assay. The x axes are the dispensation nucleotides to the sequencing reaction based on the assayed sequences. The y axes show light emission obtained as relative light units. A: ALVE region1 in blood (the mean value of methylation percentage is 81.8±2.9 in line 72 and 13.2±1.2 in 63); B: ALVE region2 in blood (the mean value of methylation percentage is 85±1.6 in line 72 and 47.6±2.3 in 63); C: ALVE region3/4 in blood (the mean value of methylation percentage is 80.8±4.8 in line 72 and 68.8±6.7 in 63); D: Promoter region of TVB in Hypothalamus (the mean value of methylation percentage is 45.7±14.8 in line 72 and 37.0±14.1 in 63).

