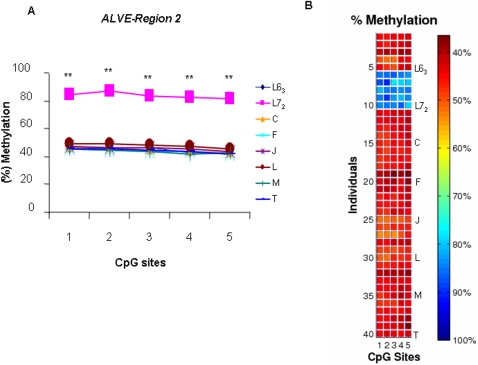
Figure 6. Methylation profiles of ALVE-region 2 in chicken inbred lines 63 and 72 and six recombinant congenic strains C, F, J, L, M and T.
A. Statistical analysis results. ** P<0.0001. B. The methylation levels are displayed in the form of a matrix. The matrix contains the data obtained form all the samples. n = 5 for each line or RCS.

