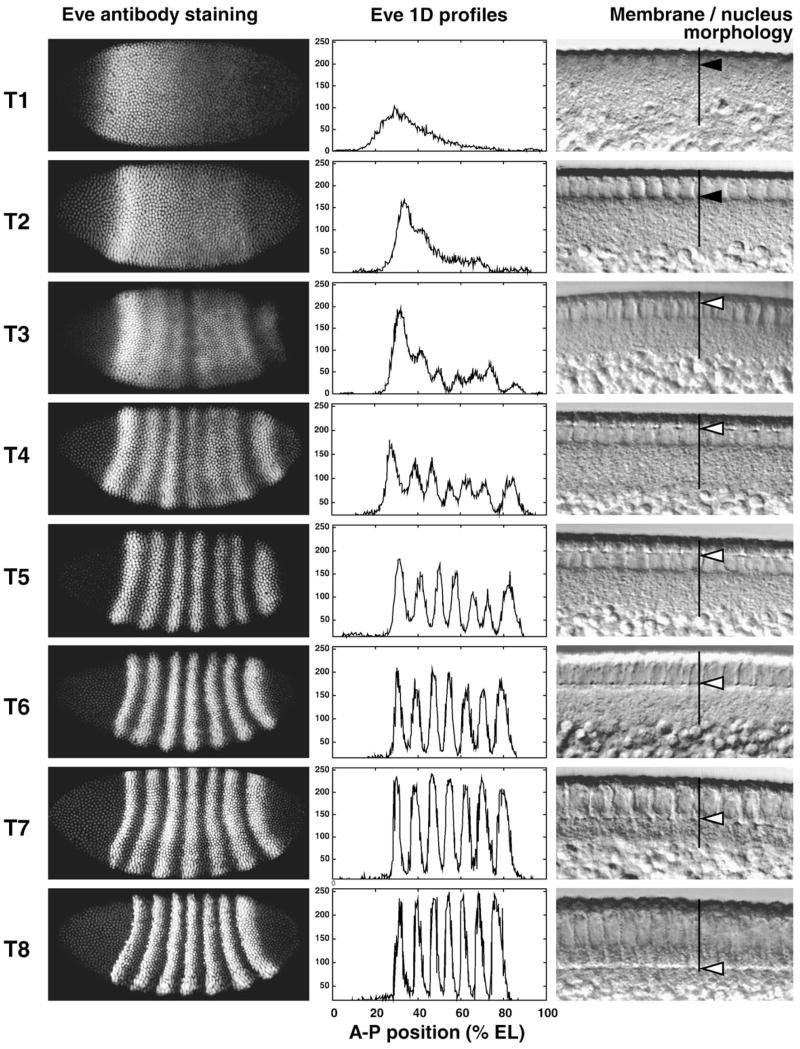
Fig. 1.
The 8 temporal classes of cycle 14A. A typical embryo of each class is shown in each row. The left-hand panel shows an image of eve expression in that embryo; the middle panel shows the segmented expression pattern from the central 10% strip; the right-hand panel shows a high magnification DIC image of the blastoderm morphology. In the DIC images vertical black lines indicate the cortical cytoplasm, the black arrows in time classes 1 and 2 indicate the elongation of nuclei, and the white arrows in time classes 3–8 show the position of membrane front.

