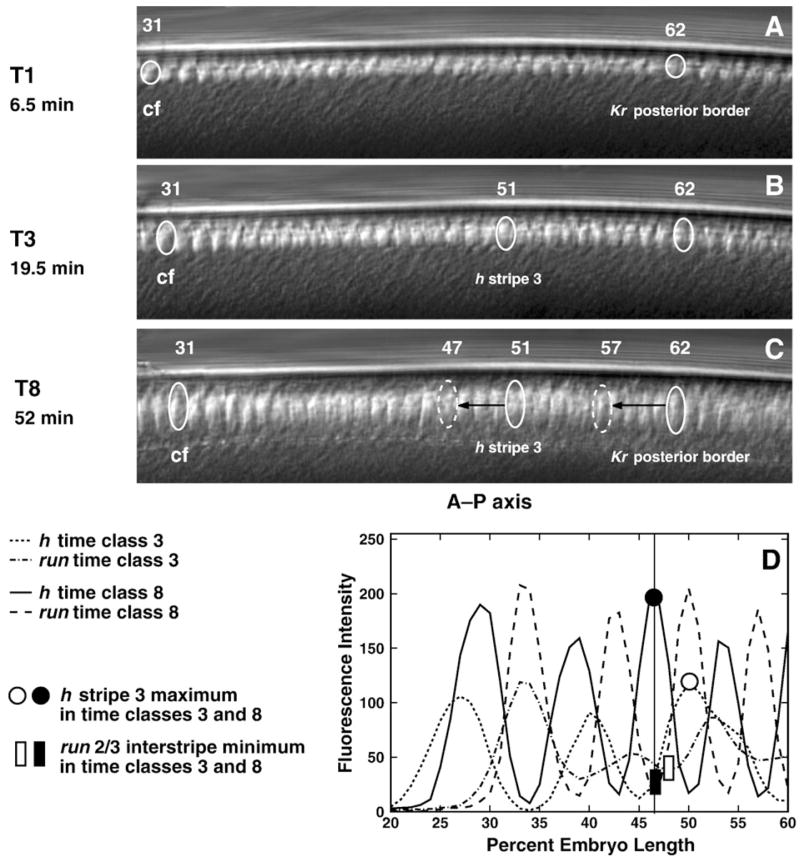
Fig. 10.
In vivo nuclear motion compared to gene expression. Panels A–C are frames from a movie of the dorsal side of a living embryo, taken at the times indicated. Panel D is a graph of run and h expression patterns at temporal classes 3 and 8. In panels A–C, the identified nucleus 31 is at the approximate position of the presumptive cephalic furrow (cf); the identified nucleus 62 is at the position of the posterior border of Kr at temporal class 1 (Supplementary Table 1); and in panel B, the identified nucleus 51 is at the position of the maximum of h stripe 3 in temporal class 3. We track the positions of these nuclei (solid ovals) during time classes 1–8 for Kr and 3–8 for h. The dashed ovals in panel C indicate the A–P positions of the posterior border of Kr domain and h stripe 3 maximum in temporal class 8. Black arrows show the distance between positions of the tracked nuclei and the real positions of the corresponding expression domains in time class 8. Similar results were obtained from the ventral and dorsal sides of 15 embryos. Panel D shows that the positions of the maximum of h stripe 3 and the minimum of the run 2/3 interstripe, which have the same A–P positions in time class 8, shift position with respect to one another between temporal classes 3 and 8.

