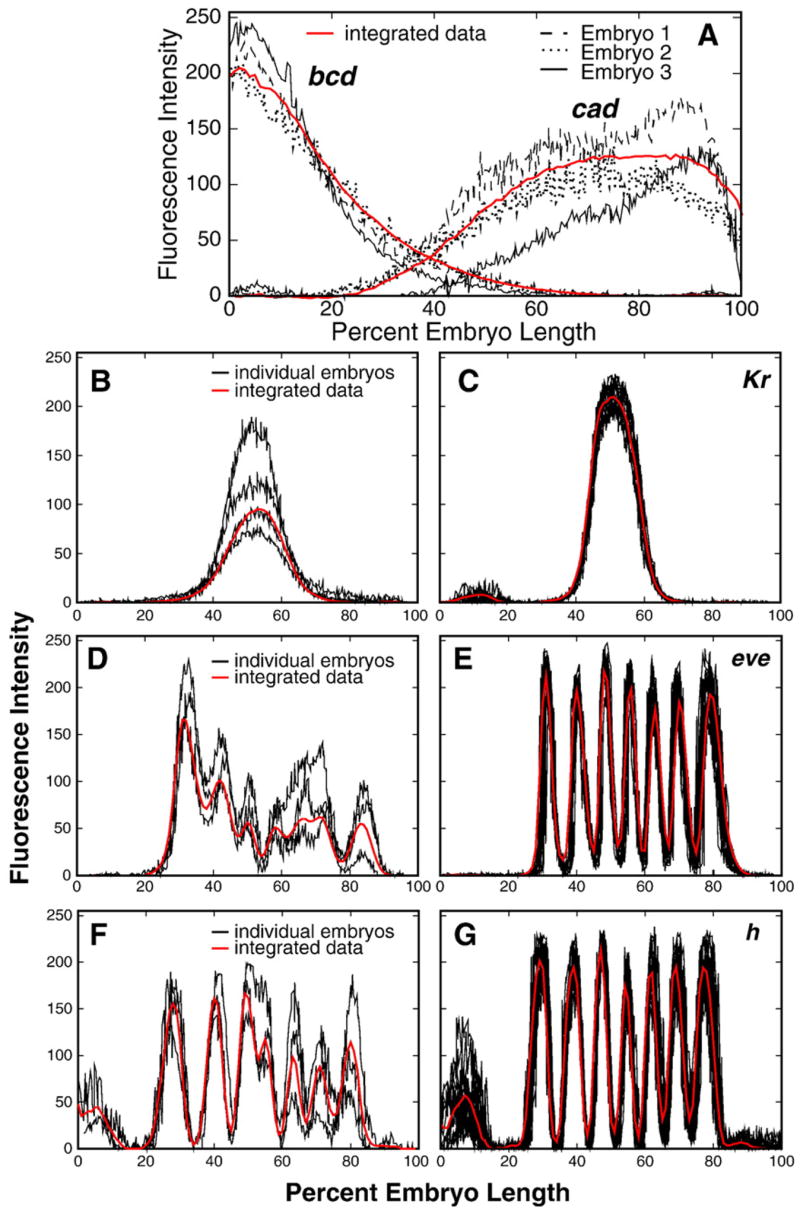
Fig. 4.

The variability of gene expression in individual embryos. bcd and cad patterns are shown in panel A for three individual embryos belonging to time class 2 and stained for the expression of both genes. Panels B, D and F show several of the most diverse patterns of early expression of Kr, eve and h in individual embryos from time classes 1, 3 and 4, respectively. The expression of Kr in time class 6 (C) eve (E) and h (G) in time class 7 is shown for a randomly chosen set of 13, 12 and 16 individual embryos respectively. For each gene the graph of the corresponding one-dimensional integrated data is shown in red.
