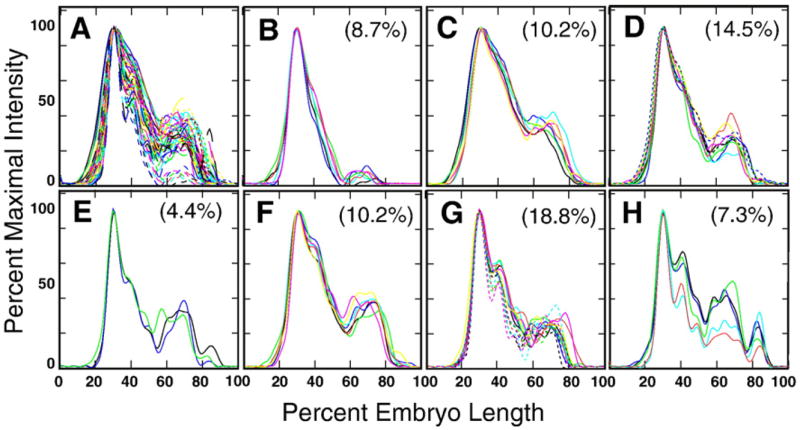
Fig. 5.

Automated classification of eve profiles for 69 embryos in temporal class 2 by self-organizing maps (SOM). (A) An overlay of all eve profiles from temporal class 2. (B–H) Seven classes of expression patterns found by SOM with the percent of the total number of embryos belonging to that class.
