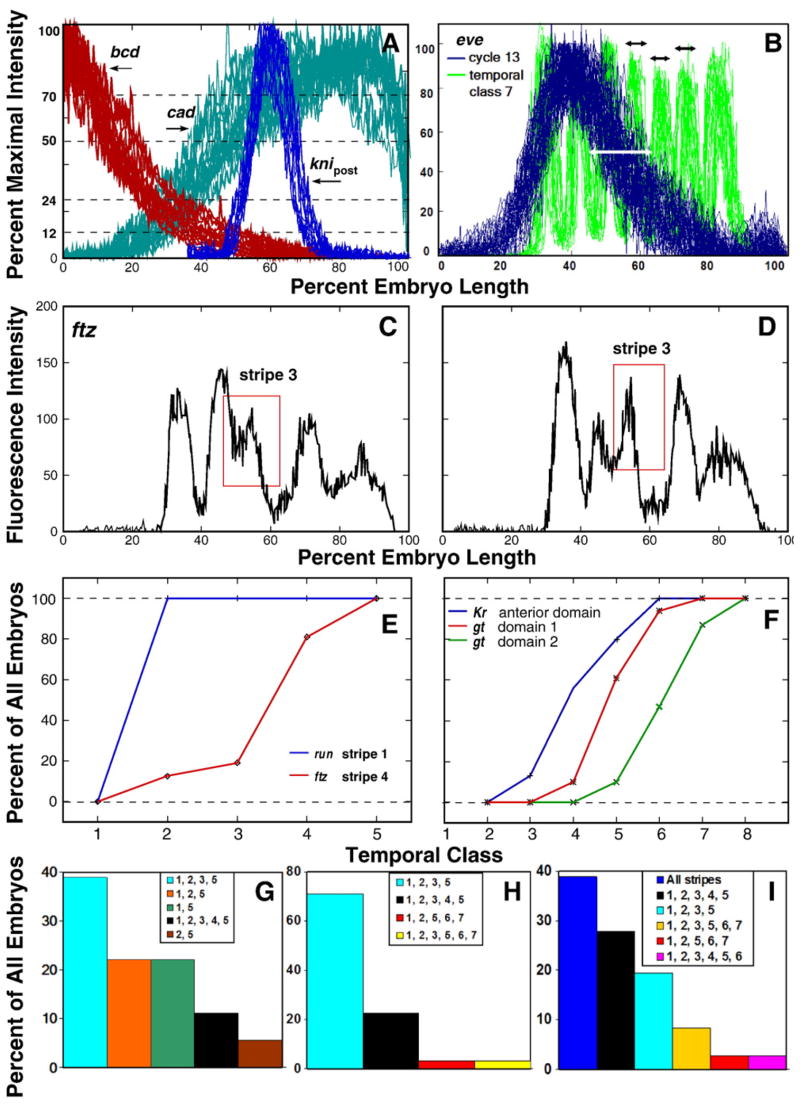
Fig. 7.
The variability in space, time, sequence and manner of domain formation. (A) The spatial variability of Bcd, Cad, and Kni domains in cycle 14A. The figure shows 26 embryos stained for bcd and cad and 18 embryos stained for kni. We show the posterior part of the kni pattern at 35–100% EL for temporal class 8. The thresholds corresponding to different percents of maximal expression are shown. (B) Spatial variability of the individual eve patterns in cycle 13 and temporal class 7 of cycle 14A. The variability in position of the posterior border of eve pattern is marked by white arrow. Black arrows mark the variability of eve stripes formed at the territory of posterior boundary of early eve. (C, D) Patterns of ftz expression in two embryos from time class 3 showing the variable mode of formation of stripe 3, which is marked with a red rectangle. (E, F) Temporal variability in formation of the pair-rule (E) and gap (F) domains indicated in the key. For each temporal class we show the percent of embryos in which the indicated domain has appeared. (G–I) Variability in the sequence of formation of stripes within the ftz pattern in temporal classes 2 (G), 3 (H), and 4 (I). Each bar shows the percent of embryos in which the indicated stripes are formed.

