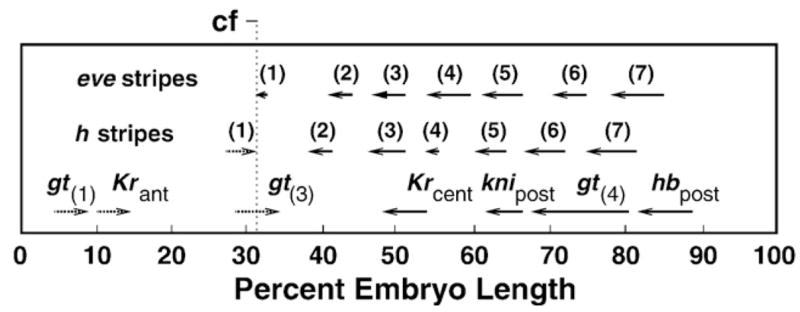
Fig. 9.

Summary of domain shifts. Direction of shifts is shown by arrows. Digits in brackets denote eve and h stripes, other domains are as indicated. Values of shifts were computed for the domain peaks over the following time intervals: from time classes 1 to 8 for gt(3), gt(4), Krcent and knipost; from time classes 2 to 8 for hbpost; from time class 3 to time class 8 for eve stripes 1–4 and 7 and h stripes 1–3; from time class 4 to time class 8 for Krant, eve stripes 5 and 6 and h stripes 4–7; from time classes 6 to 8 for gt(1). The approximate position of the prospective cephalic furrow (cf) is indicated.
