
Fig. 3.
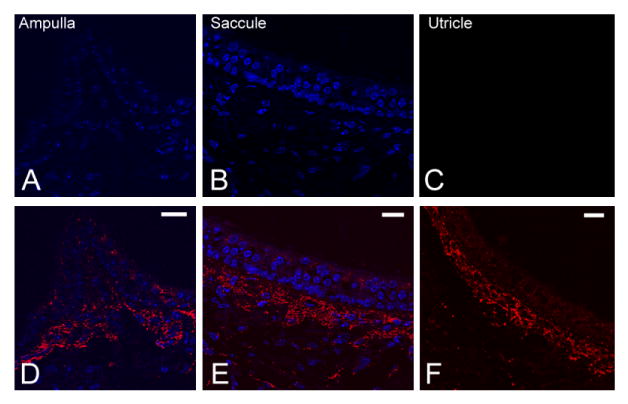
Immunolabeling data showing patterns of Cx30 (A–C) and Cx26 (D–F) expressions in the ampulla, saccule, and utricle of adult Cx30−/− mice. Sections were counterstained with DAPI (blue) to reveal locations of cell nuclei. Scale bar = ∼20 μm in D (applies to A,D); E (applies to B,E); F (applies to C,F).