
Table 2. Docking ranks and Tm0936 catalytic constants for five predicted substrates.
| Substrate tested | Docked high-energy intermediate form | Dock rank | Relative docking scores (kcal mol−1)* | Km (μM) | kcat (s−1) | kcat/Km (M−1s−1) |
|---|---|---|---|---|---|---|
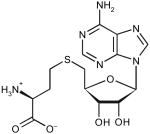
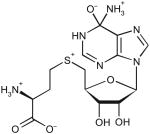
| S-adenosyl-l-homocysteine | ||||||
|
|
5 | 0 | 210 ± 40 | 12.2 ± 0.8 | 5.8 × 10⁴ |
|
| ||||||
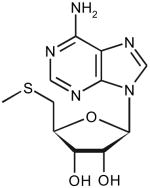
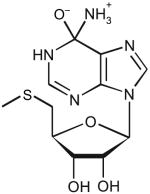
| 5-Methyl-thioadenosine | ||||||
|
|
6 | 4.4 | 44 ± 4 | 7.2 ± 0.2 | 1.4 × 10⁵ |
|
| ||||||
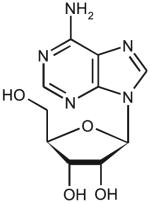
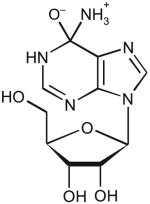
| Adenosine | ||||||
|
|
14 | 9.5 | 250 ± 40 | 2.3 ± 0.2 | 9.2 × 10³ |
|
| ||||||
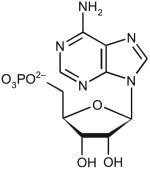
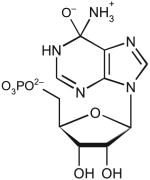
| Adenosine-5-monophosphate | ||||||
|
|
80 | 20.2 | ND | <10−3 | ND |
|
| ||||||
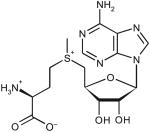
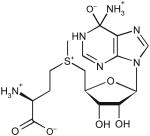
| S-adenosyl-l-methionine | ||||||
|
|
511 | 35.2 | ND | <10−3 | ND |
Deamination was measured by the production of ammonia. The standard deviations are given.
*
Docking energies relative to the best-ranked compound shown, SAH. Higher energies indicate worse scores. ND, not determined.