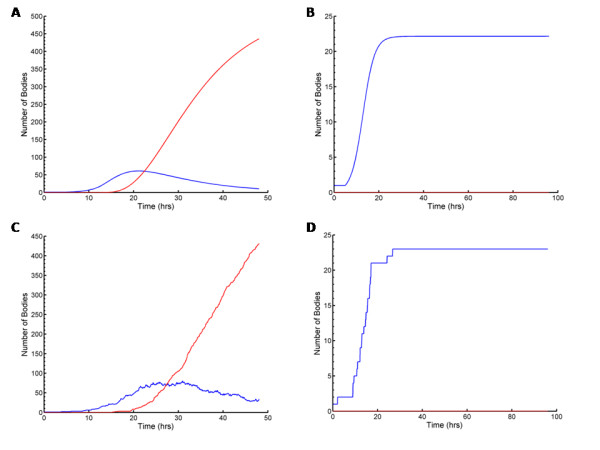
Figure 1.

Typical time course plots resulting from simulation with our mathematical models; the red curves represent the number of EBs and the blue curves represent the number of RBs. We run the deterministic model to produce (a) normal development (with the doubling time td = 1.8 hrs, rate of RB detachment k = 1.3 hrs-1, EB radius re = 0.1 μm, rate of RB-to-EB differentiation μ = 0.25 hrs-1, average spacing between T3S needles on the RB surface L = 0.04 μm, length of T3S needles lp = 0.0078 μm, volume of host cell CellVol = 2400 μm3, proportion of cell not available for inclusion growth ε = 0.3, threshold number of T3S needles per RB Plim = 23, number of inclusions N = 1, and RB radius r = 0.5 μm) and (b) persistent infection (by increasing only the size of the RB radius, r = 2.0 μm). Figures (c) and (d) show simulations of the stochastic model, using the same parameter values as used in (a) and (b) respectively.
