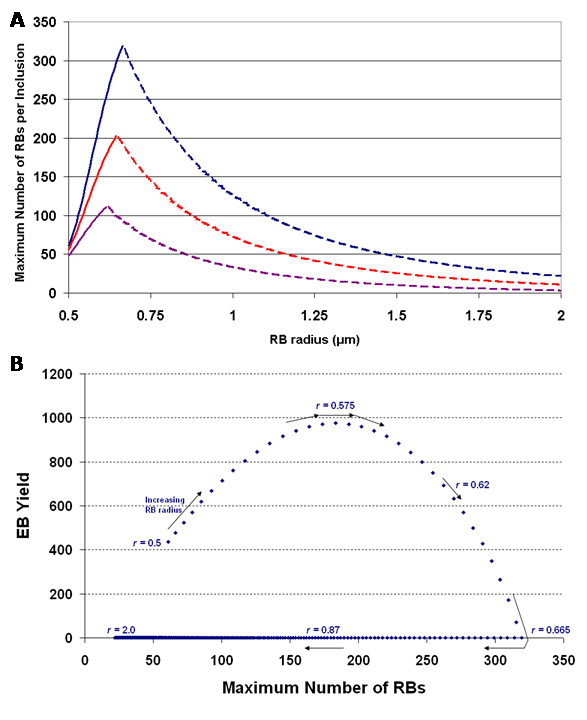
Figure 3.

(a) The maximum number of RBs attained per inclusion versus RB radius size for one inclusion (blue), two inclusions (red), and five inclusions (magenta). The solid section of the curves corresponds to normal development and the dashed section corresponds to interrupted development leading to a persistent mode of growth. (b) The relationship between EB yield and the maximum number of RBs within a single inclusion. Each point represents a different value for the RB radius, with the radius increasing in the direction of the arrows. Parameter values used were: doubling time td = 1.8 hrs, rate of RB detachment k = 1.3 hrs-1, EB radius re = 0.1 μm, rate of RB-to-EB differentiation μ = 0.25 hrs-1, average spacing between T3S needles on the RB surface L = 0.04 μm, length of T3S needles lp = 0.0078 μm, volume of host cell CellVol = 2400 μm3, proportion of cell not available for inclusion growth ε = 0.3, and threshold number of T3S needles per RB Plim = 23.
