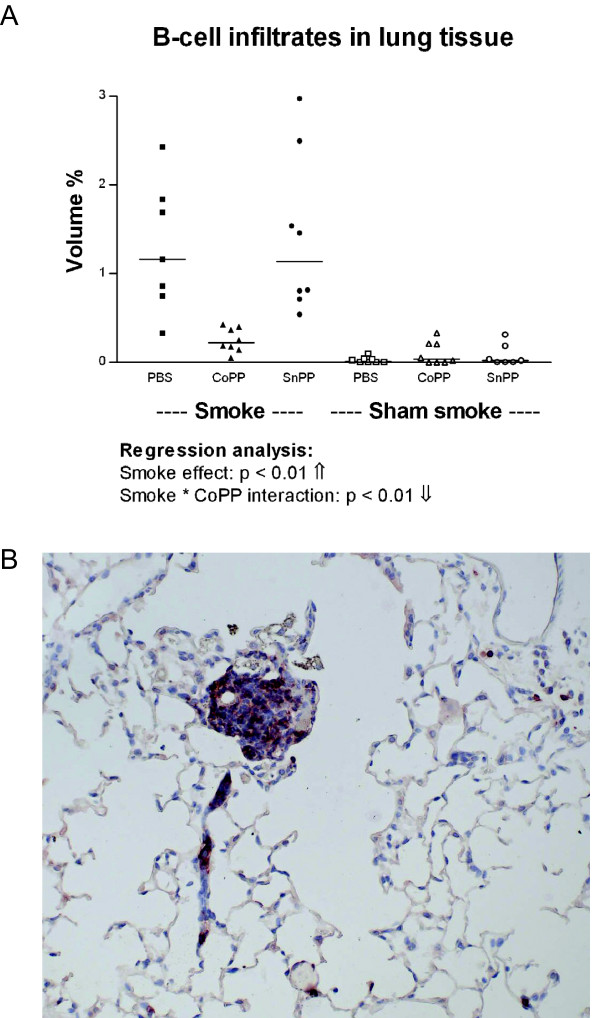
Figure 5.
B-cell infiltrates in lung tissue. A: Volume percentage of B220 positive infiltrates after long term smoke exposure and protoporphyrin treatment. Smoke groups are represented by closed symbols and sham smoke groups by open symbols. The significant results of the regression analysis are depicted beneath the figure. B: Example of a B-cell infiltrate positive for B220 (red) present in lung tissue (50×).

