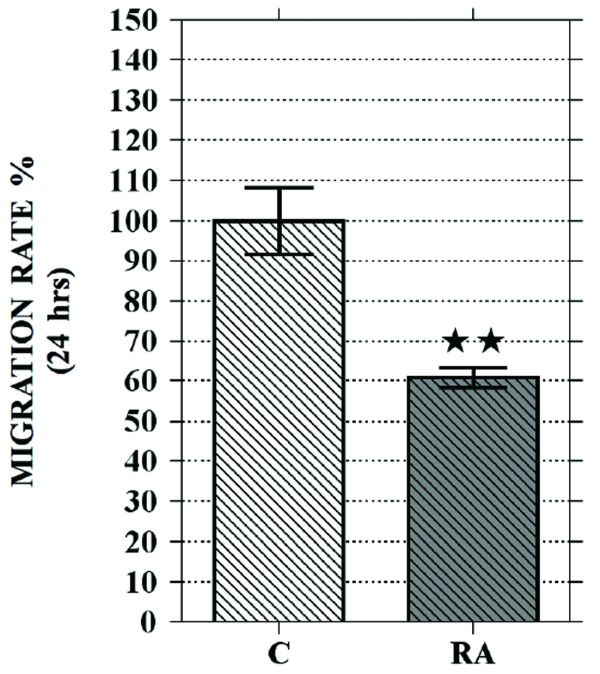
Figure 7.
Quantification of RA effect on neuroblastoma cell motility. Graph shows that NB cell migration rate of 6 days RA treated cells (RA) is significantly reduced in comparison with untreated cells (C). Data are obtained from a set of scratch test analysis and are expressed as means ± standard error; N = 4;double star = p < 0.01.

