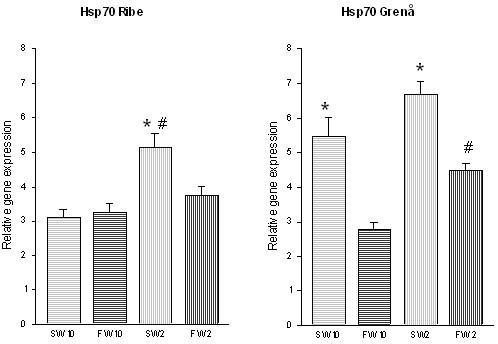
Figure 3.

Expression of hsp70 in gill tissue of trout from River Ribe and River Grenaa following acclimation to freshwater (FW) and seawater (SW) at 2°C and 10°C. Amounts of hsp70 mRNA are normalized to the corresponding EF1α abundance from the same sample, and mean values are expressed in arbitrary units ± SE (number of individuals in experimental groups: n = 8). * indicates significant difference between salinity treatments (P < 0.05) and # indicates significant difference between temperature acclimation groups at the same salinity (P < 0.05).
