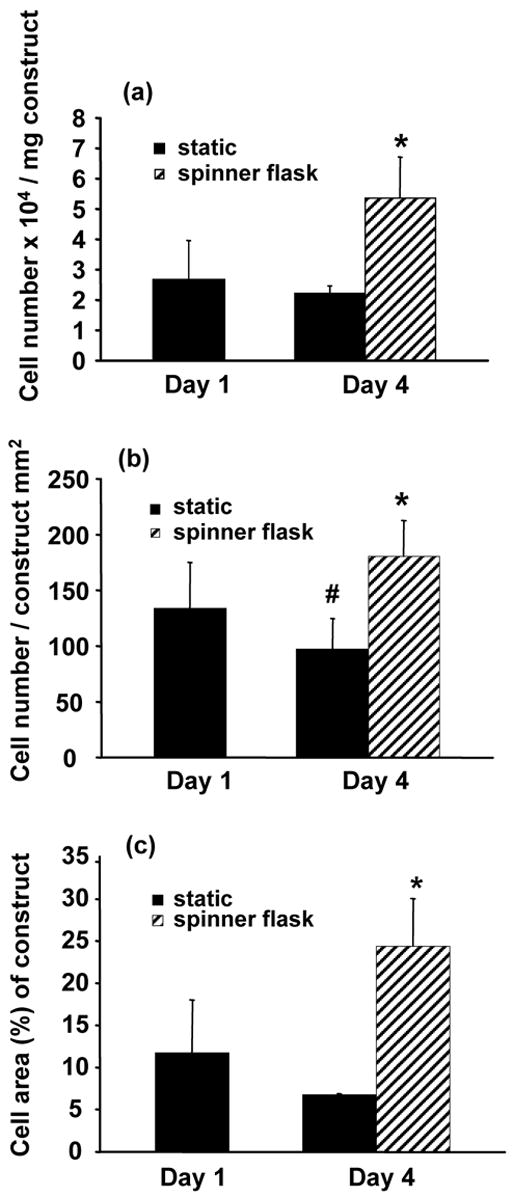
Fig. 3.

(a) SMC viability by MTT, and quantitative image analysis of H&E sections for (b) number of SMC nuclei and (c) percentage of SMC area relative to scaffold area on microintegrated conduits at 1 day and 4 days after fabrication after static or spinner flask culture at 15 rpm. Spinner flask culture of conduit sections was initiated after 1 day of static culture (*p < 0.05 greater than static 1 day and static 4 day samples, #p < 0.05 less than static 1 day samples).
