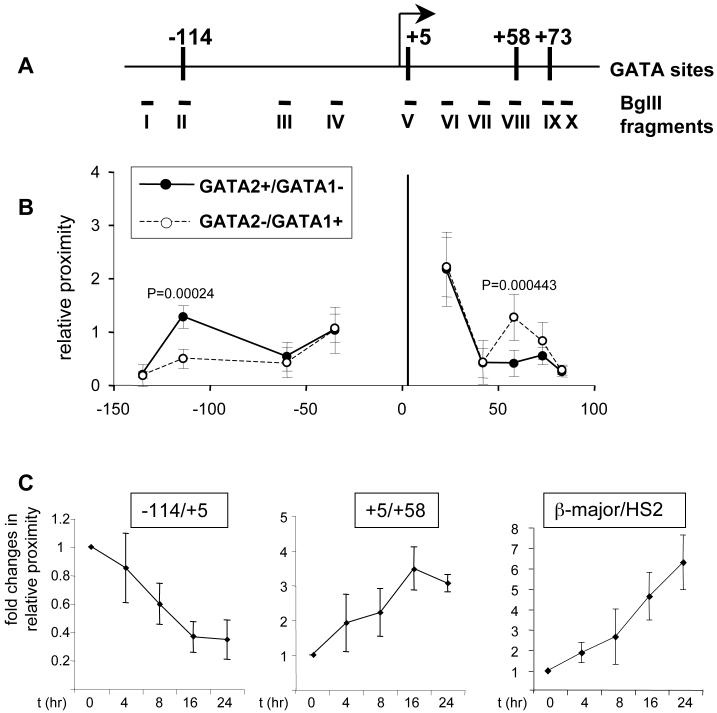
Figure 4. 3C analysis of the Kit locus.
(A) Schematic of the Kit locus. Vertical bars demarcate sites bound by GATA-1 or GATA-2. Bgl II fragments used for 3C assay are indicated by Roman numerals.
(B) 3C assay in G1E cells or estradiol-treated (21 hours) G1E-ER4 cells. Fragment V (vertical bar at position +5) served as “fixed” fragment. GATA-2+/GATA-1- represents parental G1E cells. GATA-2-/GATA-1+ represents estradiol-treated G1E-ER4 cells. Results are averages of 5 independent experiments. Error bars represent standard deviation.
(C). Time course 3C analysis of the interaction between -114/+5 (left panel), +5/+58 (middle panel) and HS2/β-major (right panel) in G1E-ER4 cells treated with estradiol for 0, 4, 8, 16 and 24hrs. Results are averages of 4 (left panel), 3 (middle panel), and 3 (right panel) independent experiments.

