
Figure 3.
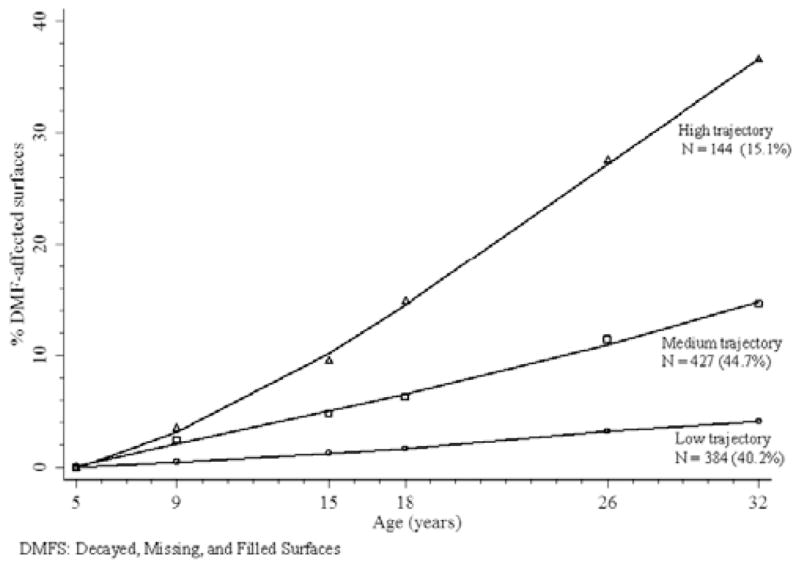
Plot of mean percentage of at-risk surfaces affected by caries over time for three-group caries trajectory analysis model.
Official websites use .gov
A
.gov website belongs to an official
government organization in the United States.
Secure .gov websites use HTTPS
A lock (
) or https:// means you've safely
connected to the .gov website. Share sensitive
information only on official, secure websites.
Plot of mean percentage of at-risk surfaces affected by caries over time for three-group caries trajectory analysis model.