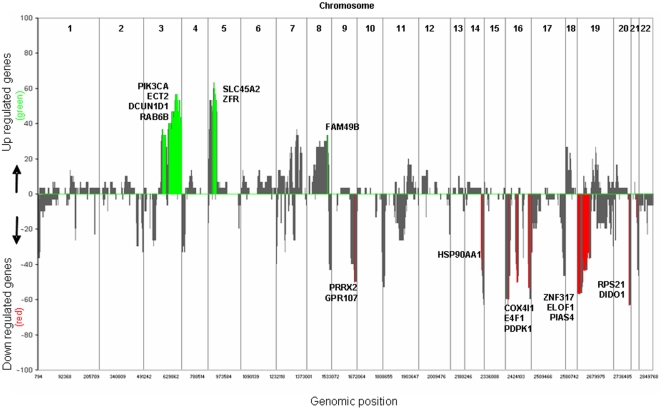
Figure 1. Percentage of called gains and losses and their effect on gene expression in 32 NSCLC patients.
Summary plot for called gains and losses in 32 resected NSCLC patients with DNA copy number changes indicated in grey. Positive values indicate the percentage of samples found with a gain. Negative values indicate the percentage of samples harboring a loss at the specified chromosome location. Genes in specified regions affected by copy number gain are indicated in green and genes affected by copy number loss are indicated in red. A selection of affected genes is indicated. The full list of 359 affected transcripts can be found in supplementary table S1.

