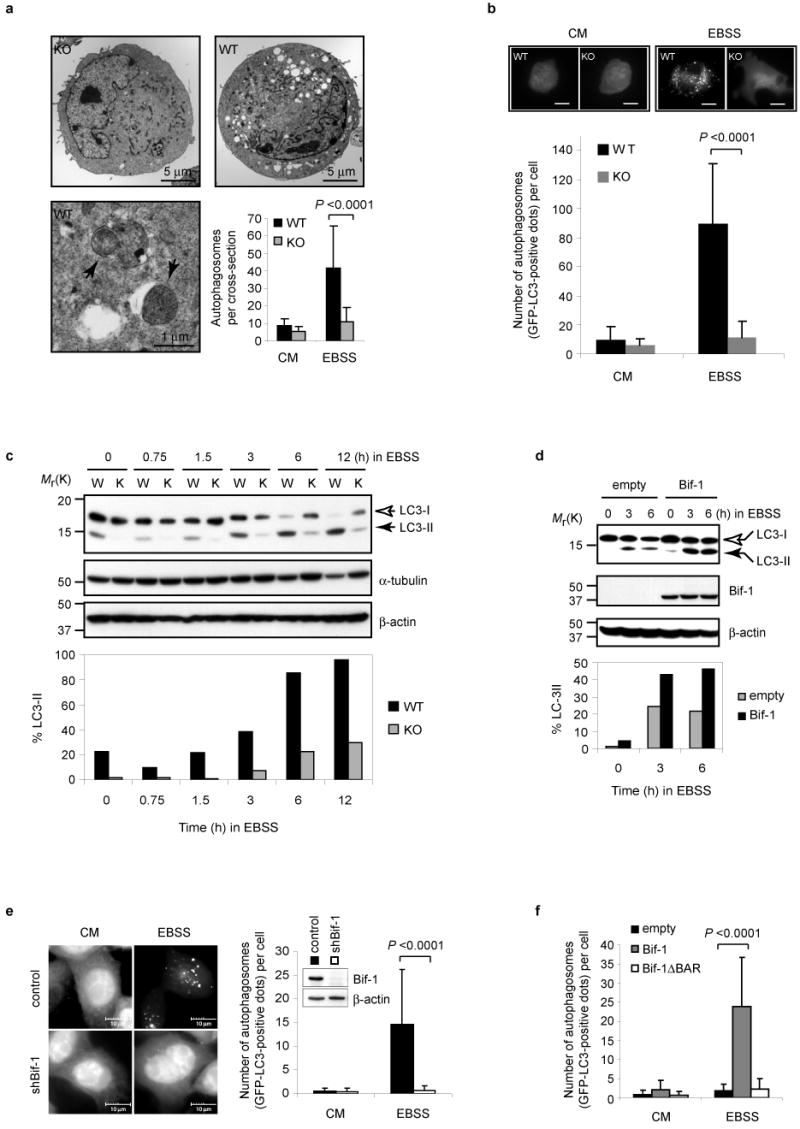
Figure 3.

Loss of Bif-1 inhibits autophagy. (a) Bif-1 WT and KO MEFs were cultured in complete medium (CM) or EBSS for 3 h and analyzed by transmission electron microscopy. Arrows indicate autophagosomes. The number of autophagosomes per cross-sectioned cell was counted (mean ± s.d.; n = 42). (b) Bif-1 WT and KO MEFs were transfected with GFP-LC3, cultured in EBSS or CM for 3 h, then analyzed by fluorescent microscopy. Scale bars indicate 10 μm. The number of GFP-LC3 dots per GFP-positive cell was counted (mean ± s.d.; n = 35). (c) Bif-1 WT (W) and KO (K) MEFs were cultured in EBSS for the indicated times and subjected to immunoblot analysis with anti-LC3, α-tubulin and β-actin antibodies. (d) Bif-1 KO MEFs stably transfected with a Bif-1 expression plasmid or control empty vector were cultured in EBSS for 0, 3 or 6 h and subjected to immunoblot analysis. The immunoblotting results of LC3 in c and d were quantified as the percentage of LC3-II out of total LC3 (LC3-I + LC3-II) and are represented in bar graphs. (e) Stable shBif-1 expressing clones or control HeLa cells transfected with GFP-LC3 were cultured in CM or EBSS for 2 h and analyzed by fluorescent microscopy. The number of GFP-LC3 dots per GFP-positive cell was quantified (mean ± s.d.; n = 66). (f) Bif-1 knockdown HeLa cells were transfected with GFP-LC3 in combination with shBif-1 resistant Bif-1-HcRed, Bif-1ΔBAR-HcRed or empty HcRed vector for 20 h. The cells were then cultured in EBSS or CM for 2 h and the number of GFP-LC3 dots per HcRed-positive cell was determined using a fluorescent microscope (mean ± s.d.; n = 35). Statistical significance in a, b, e and f was determined by Student's t test. The full scans of the immunoblots shown in c, d and e are presented in the Supplementary Information, Fig. S5.
