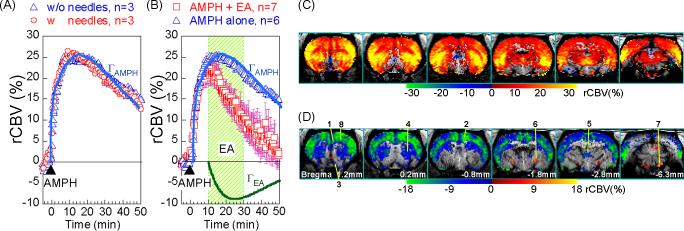
Figure 1.
rCBV time course from the AMPH+EA group (n=7) was decomposed to AMPH (ΓAMPH ) and EA (ΓEA ) components using gamma fit. (A) Rats with and without needle insertion had similar rCBV time courses in response to AMPH challenge. (B) EA at LI4 significant attenuated the “AMPH-induced rCBV increase”. Dots represent data points and solid lines show the GLM fittings of ΓAMPH and ΓEA. Timecourses were from CPu. (C) Map of ΓAMPH shows that brain areas with copious amount of DA release, in response to AMPH challenge. (D) Map of ΓEA shows brain areas effected by EA, with attenuation in blue tone and enhancement in red tone. 1. mPFC, 2. Cing, 3. NAc, 4. CPu, 5. thalamus, 6. LGP, 7. SNR, 8. M1.

