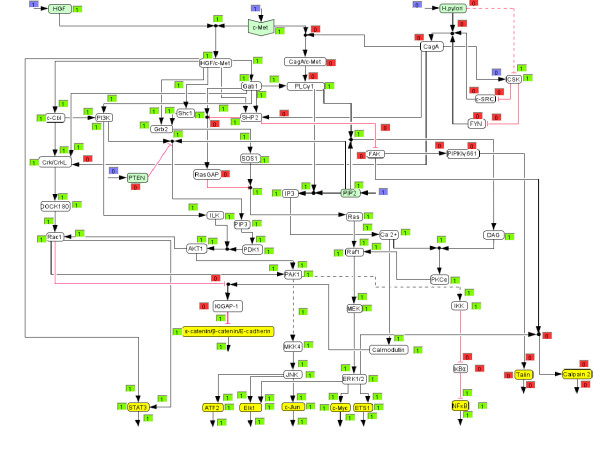
Figure 3.
HGF triggered signalling network (screenshot of CellNetAnalyzer). Each species and each hyperarc has an associated text box displaying a logical value. Blue boxes indicate clamped (fixed) values prior computing the logical steady state (i.e. the network response). Green boxes ("on") indicate an active species or activating signal flow, respectively. Red boxes ("off") indicate inactive (or absent) species or, in the case of hyperarcs, connections along which no activation of the end species of the hyperarc takes place.

