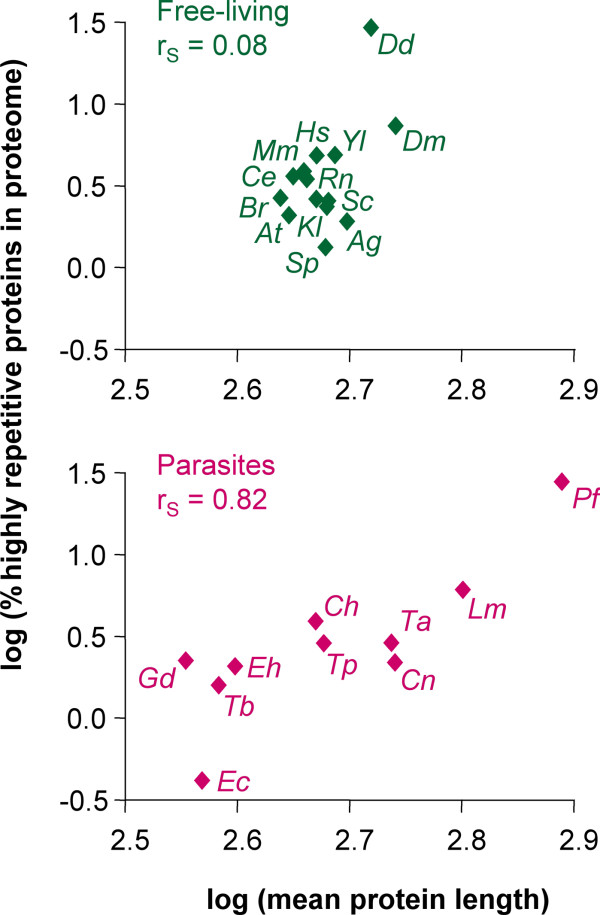
Figure 1.
Comparative genomics of repeat-containing proteins. Double logarithmic plot of the percentage of highly repetitive (P < 10-10) proteins vs. mean protein length of eukaryotic proteomes. Ag, A. gambiae; At, A. thaliana; Br, B. rerio; Ce, C. elegans; Dd, D. discoideum; Dm, D. melanogaster; Hs, H. sapiens; Kl, K. lactis; Mm, M. musculus; Rn, R. norvegicus; Sc, S. cerevisiae; Sp, S. pombe; Yl, Y. lipolytica; Ch, C. hominis; Cn, C. neoformans; Ec, E. cuniculi; Eh, E. histolytica; Gd, G. duodenalis; Lm, L. major; Pf, P. falciparum; Ta, T. annulata; Tb, T. brucei; Tp, T. parva; rS, Spearman coefficient.

