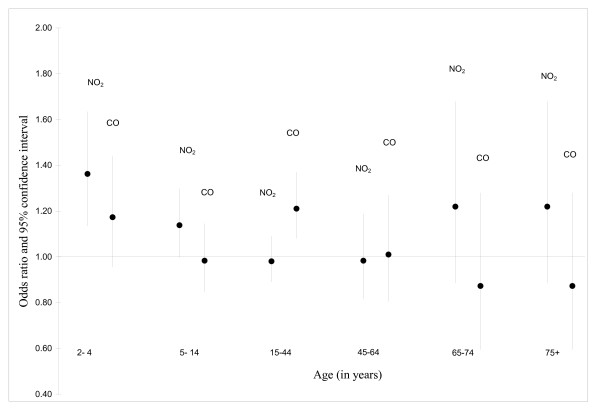
Figure 2.
Associations between asthma visits and levels of NO2 and CO. Adjusted odds ratios obtained from a two-pollutant model in relation to an increase in the interquartile range of 5-day average concentration of NO2 and CO, Edmonton, April 1 to September 30, 1992 to 2002; Adjusted for relative humidity, temperature and daily number of emergency department visits for influenza.

