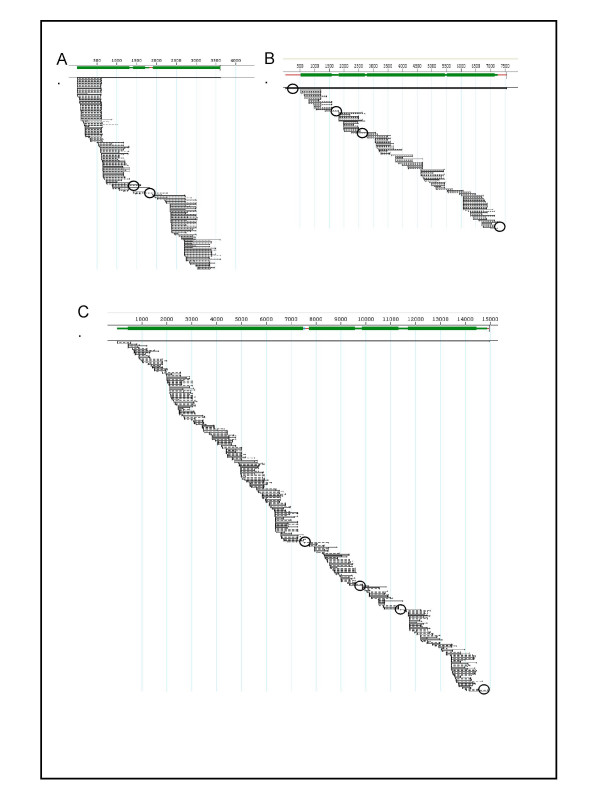
Figure 3.
Representative assemblies of viruses described in this study. Images shown were generated using DNASTAR Seqman program. A. Enterobacteriophage MS2 (3569 bp). B. Human Rhinovirus 16 (7124 bp). C. Newcastle disease virus Lasota (15186 bp). All assemblies have been aligned with their reference genomes. Gaps and low coverage areas which require closure are circled.

