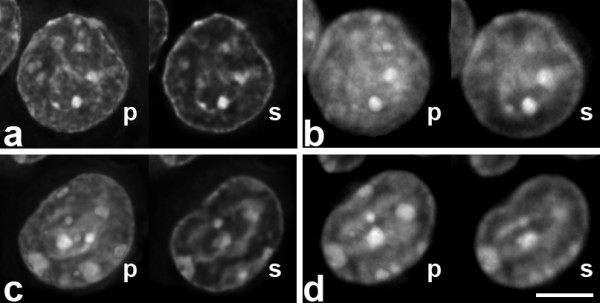
Figure 4.

Two counterstained nuclei before (a, c) and after FISH (b, d). Shown are projections (p) and single sections (s) of deconvolved image stacks. Nuclei after FISH are generally more blurry. Single sections from before and after FISH were selected manually to approximate the same nuclear depth. Scale bar 5 μm.
