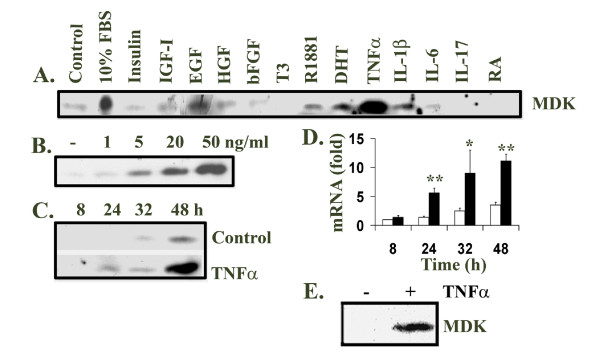
Figure 2.
Midkine expression was induced by FBS, growth factors and cytokines. A. LNCaP cells were cultured in serum-free DMEM and treated for 48 h with 10% FBS and the indicated agents: 10 ng/ml insulin, 10 ng/ml IGF-I, 10 ng/ml EGF, 10 ng/ml HGF, 10 ng/ml bFGF, 20 ng/ml T3, 10 nM R1881, 10 nM DHT, 10 ng/ml TNFα, 10 ng/ml IL-1β, 50 ng/ml IL-6, 50 ng/ml IL-17, and 33.3 μM RA. B. LNCaP cells were treated with different dosages (1 to 50 ng/ml) of TNFα for 48 h. C. LNCaP cells were also treated with 20 ng/ml TNFα for different time periods (8 to 48 h). 20 μl of each medium supernatant was subjected to Western blot analysis of midkine expression using rabbit anti-midkine antibodies, horseradish peroxidase-conjungated secondary antibodies and enhanced chemiluminescence reagents. D. Total RNA was extracted from LNCaP cells not treated or treated with 20 ng/ml TNFα, using RNeasy Mini Kit; cDNA was made from total RNA using Superscript™ First-Strand Synthesis System with oligo dT primers; real-time quantitative PCR was done in triplicates with Sybr-Green reagents; results were normalized to GAPDH levels as described in Methods; the data (mean ± standard deviation of three independent experiments) were presented as fold change of midkine mRNA compared to the LNCaP cells without treatment for 8 h, where fold = 2ΔΔCt; solid bar, TNFα treated; open bar, control; * P < 0.05 and **P < 0.01, compared to the corresponding controls. E. PC3 cells were cultured in serum-free medium and treated for 48 h with or without 20 ng/ml TNFα. 20 μl of each medium supernatant was subjected to Western blot analysis of midkine expression.

