
Figure 1b.
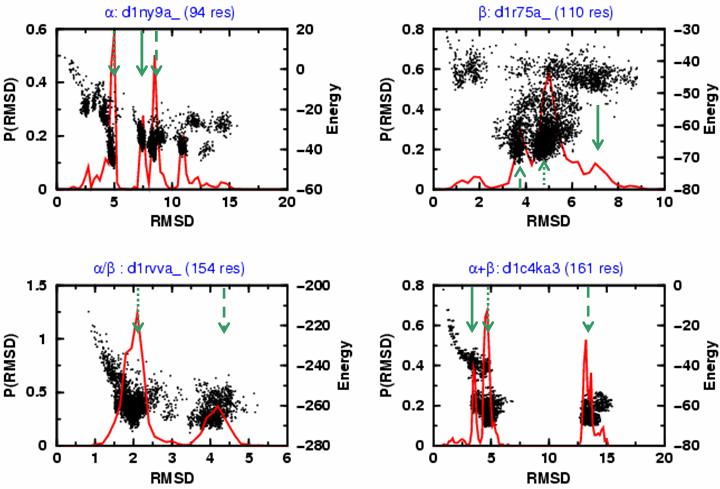
The distribution of RMSD values from native distribution (solid red curve) is plotted together with the energy values obtained for sampled conformations (black dots) for d1ny9a_, d1r75a_, d1rvva_ and d1c4ka3, the same protein folds shown in Fig. 1a. The green arrows indicate the locations of: (1) the most probable RMSD value (denoted RMSA and marked with a dotted green arrow); (2) the second most probable RMSD value (denoted RMSB, dashed green arrow); and (3) the third most probable RMSD value (denoted RMSC, solid green arrow). In many cases, there is a clear separation of clusters of conformations based on their energy and RMSD values (d1r75a_, an all-β fold is an exception). The most probable cluster is often the closest to the native structure (i.e. RMSA is smaller than RMSB or RMSC).