
Figure 2.
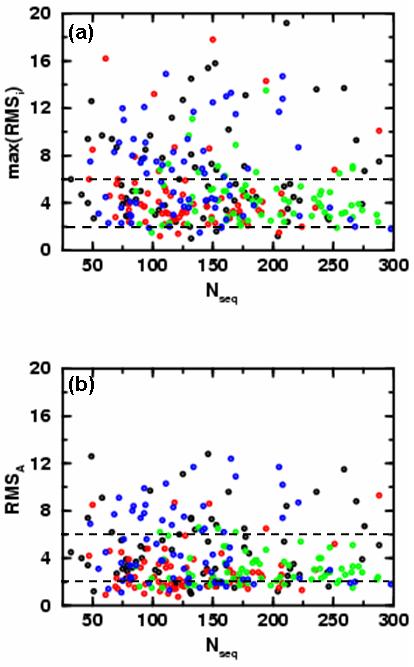
Showing the variation of the basin RMSD from crystal structure with the size of protein, (Nseq). We show the results for all 280 domains studied here: domains from α, β, α/β and α+β topological classes are colored black, red, green and blue, respectively. Here we consider the three most probable basins for each protein, RMSA, RMSB and RMSC (see Fig. 1b). In (a) we show the RMSD value of the least native-like of the top three dominant energy basins (max(RMSA,RMSB,RMSC)) as a function of the number of residues. One third of the domains (88 out of 280, 31.4 %) have RMSD values above 6 Å (dashed black horizontal line). On average α/β and β domains remain closer to the native state than other classes of domains. Only 4.29 % of proteins have RMSD values below 2 Å (dashed black horizontal line). 90 % of all-α, all-β, α/β and α+β class domains are below thresholds of 12.7 Å, 8.5 Å, 6.9 Å and 12.0 Å, respectively. In (b) we show the RMSD value of the most dominant energy basin (RMSA) as a function of the number of residues. In this case, only 19.3 % (54 out of 280) of the domains have RMSD values above 6 Å (dashed black horizontal line) and almost all (66 out of 70 or 94.3 %) α/β domains are below the 6 Å line. 90 % of all-α, all-β, α/β and α+β class domains are below thresholds of 9.1 Å, 4.8 Å, 5.0 Å and 9.2 Å, respectively.