
Figure 6.
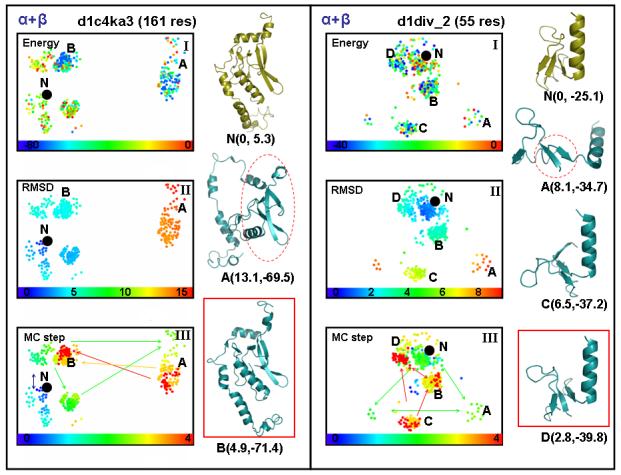
showing the same two-dimensional projection of conformational space used in Fig. 4 but now for two α + β domains, d1c4ka3, which has 161 residues, and d1div_2, which is much smaller with 55 residues. In the case of d1c4ka3, the two major conformational clusters are marked by A and B according to the order they were visited. The MC step subplot in panel (III) shows how the initially visited conformations (green nodes) transforms into orange and then finally red exploration paths (the single headed arrows between clusters point towards lower energy ones, the double headed arrows between clusters indicate their similar energy). The snapshots of the conformations show that the sampling path passes through a very unfolded state (basin A) before locating a near-native, low-energy conformation in basin B (framed in red). In the case of d1div_2, there are four major conformational clusters denoted A to D in the order visited. The representative conformations for each cluster are depicted. The snapshots of the conformations show that the simulation passes through very unfolded states (basins A and C) before locating an near-native, low-energy conformation in basin D (framed in red).