Figure 3.
Light-Dependent Translocation of GFP-ROP2 to the Plasma Membrane in Guard Cells.
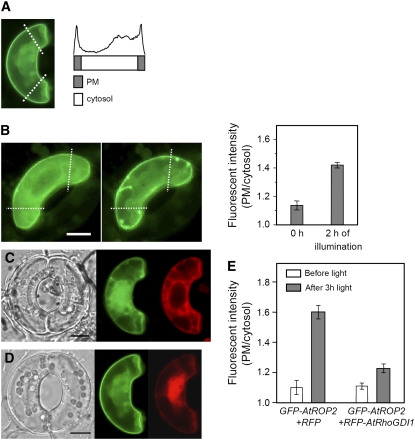
(A) Cartoon describing how GFP-ROP2 localization to the plasma membrane (PM) and cytosol was measured. From the fluorescent images of guard cells expressing GFP-ROP2, GFP intensity was line-scanned along two lines drawn at right angles to the long axis of the cells, at ∼25% distance from both ends (white dotted lines in the left panel). The average pixel intensities of the plasma membrane (gray bar) and the cytosol (white bar) were obtained from the GFP intensity profiles as indicated.
(B) Light illumination induces GFP-ROP2 translocation to the plasma membrane. The intensity of GFP-ROP2 localized to the plasma membrane was measured as described for (A) before and after 2 h of illumination from individual guard cells. The resulting pixel intensity of plasma membrane/cytosol is displayed (right panel; means ± se; n = 11, P < 0.02). Stomatal movements are inhibited by mounting the epidermal pieces between the cover slip and the slide glass during observations. Focus was on the mid-plane of the cells. Bar = 10 μm.
(C) and (D) Intact V. faba guard cells transformed with GFP-ROP2 and RFP-RhoGDI1 (C) or GFP-ROP2 and RFP alone (D) and incubated under light for 3 h. Bars = 10 μm.
(E) Relative pixel intensity at the plasma membrane of GFP-At ROP2 from guard cells transiently transformed with GFP-ROP2 together with RFP-RhoGDI1 (C) or with RFP (D) in darkness or after 3 h of illumination. Results from three independent experiments are shown (means ± se; n = 32 to 60).

