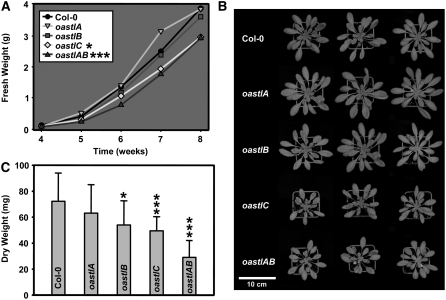
Figure 2.
Growth Phenotype of oastl Insertion Lines.
All plants were grown on soil in a growth chamber under short-day conditions.
(A) Fresh weight of aerial parts. Mean values from five plants are shown. Growth retardation of oastlC and oastlAB was statistically significant from week 4 on.
(B) Top view of the wild type and oastl insertion lines.
(C) Dry weights of aerial parts (n = 20). Mean values ± sd are shown.
Asterisks indicate statistical significance (* P < 0.05 > 0.01; *** P < 0.001).

