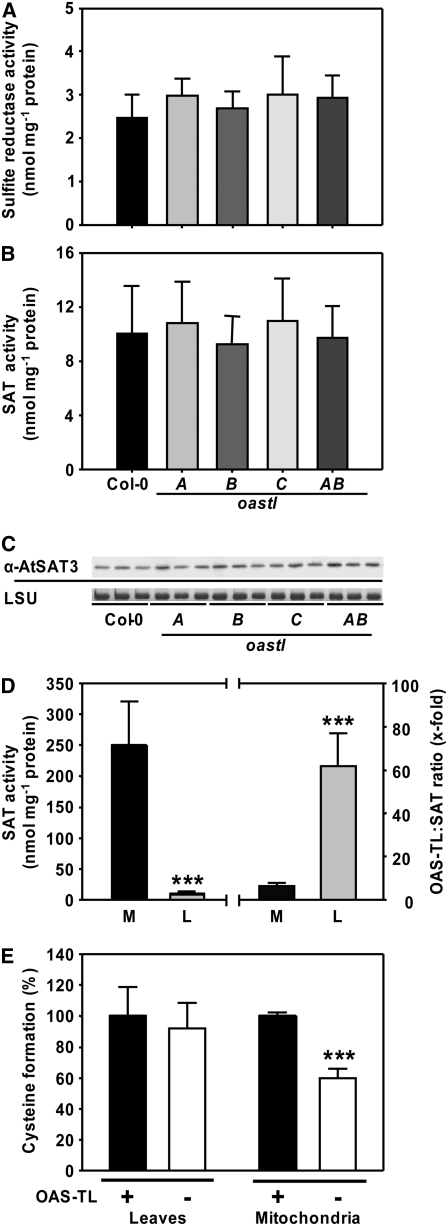
Figure 7.
Specific Activities of SAT and Sulfite Reductase.
(A) and (B) Mean values ± sd from five independent protein extractions of the wild type and oastl insertion lines are shown.
(C) An immunoblot loaded with protein from three extractions of leaves of each genotype was detected with an At SAT3 polyclonal antiserum. Staining of the large subunit of ribulose-1,5-bisphosphate carboxylase/oxygenase protein (LSU) with Coomassie blue in the same samples confirmed equal loading in the individual lanes.
(D) Specific SAT activity in crude extracts of leaves (L) and isolated mitochondria of cell cultures (M). Mean values ± sd from three independent protein extractions are shown (left). The ratio of OAS-TL to SAT in the respective fractions is shown at right. *** P < 0.001.
(E) Conversion of OAS, synthesized by SAT in the assay, to Cys in the absence (−) and presence (+) of a 100-fold excess of OAS-TL activity achieved by the addition of recombinant OAS-TL A. The capacity for Cys formation in the presence of recombinant OAS-TL activity was set to 100% in crude extracts of leaves (L) and isolated mitochondria (M). In contrast with endogenous total OAS-TL, the mitochondrial OAS-TL failed to convert all SAT-synthesized OAS to Cys, which confirms the low mitochondrial OAS-TL:SAT activity ratio (see [D]).

