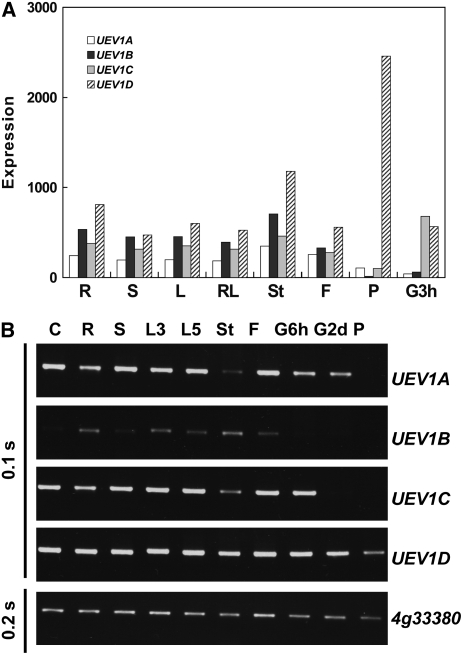
Figure 4.
Tissue Distribution of UEV1 Expression.
(A) Relative expression of UEV1 transcripts in different tissues was determined using data from the Arabidopsis NASCArrays microarray database (http://affymetrix.Arabidopsis.info/narrays/experimentbrowse.pl) (Craigon et al., 2004). R, roots of 17-d plants; S, shoots of 8-d seedlings; L, rosette leaf 2 of 17-d plants; RL, mature rosette leaves of 23-d plants; St, second internode of 21-d plants; F, stage 12 flowers of 21-d plants; P, mature pollen; G3h, seed germinating for 3 h. The original microarray data are from AtGenExpress: Expression Atlas of Arabidopsis Development (TAIR accession number 1006710873: ATGE_9, ATGE_12, ATGE_24, ATGE_27, ATGE_33, ATGE_73, and ATGE_96 samples) (Schmid et al., 2005), except for G3h data, which are from AtGenExpress: Expression Profiling of Early Germinating Seeds (TAIR accession number 1007966994: RIKEN-PRESTON2 sample).
(B) Expression of UEV1 transcripts in different tissues analyzed by RT-PCR. The At4g33380 gene was assayed as an input control (Czechowski et al., 2005). The exposure time of the gels is shown at left (BioDoc-It System; UVP). C, cell suspension; R, roots of 13-d seedlings; S, shoots of 13-d seedlings; L3, leaves of 3-week plants; L5, leaves of 5-week plants; St, stems of 5-week plants; F, floral tissues of 5-week plants; G6h and G2d, seeds germinating on Petri dishes for 6 h and 2 d, respectively; P, pollen.

