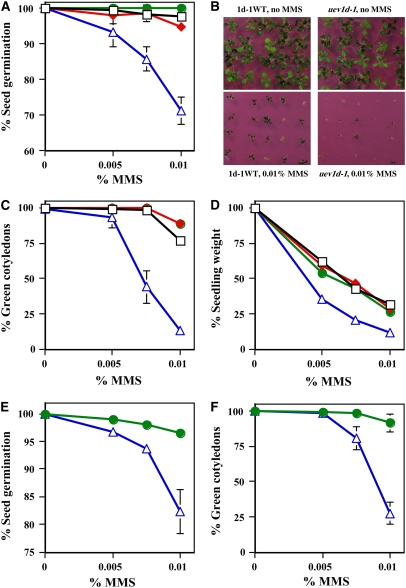
Figure 6.
Phenotypic Analysis of DNA Damage Response during Seed Germination.
(A) to (D) The homozygous uev1d-1 mutant (open triangles) is compared with three controls: Columbia (open squares), an unrelated T-DNA insertion line, SALK_042051 (closed diamonds), and a wild-type segregant line from the same SALK_064912 seeds (1d-1WT; closed circles). Synchronized seeds were sown on half-strength Murashige and Skoog agar plates with or without MMS as indicated and incubated for the given period, and phenotypes were quantitatively assessed.
(A) Percentage of seed germination after 5 d.
(B) Representative photographs after 13 d.
(C) Percentage of seedlings with green cotyledons after 13 d.
(D) Relative fresh weight of seedlings with green cotyledons after 13 d.
(E) and (F) The homozygous uev1d-2 mutant (open triangles) is compared with 1d-2WT, a wild-type segregant from the same T-DNA insertion line SALK_052144 (closed circles).
(E) Percentage of seed germination after 5 d.
(F) Percentage of seedlings with green cotyledons after 13 d.
All data are averages of three independent experiments with sd.

