
Fig. 2. NE (40 µM) inhibits Ih.
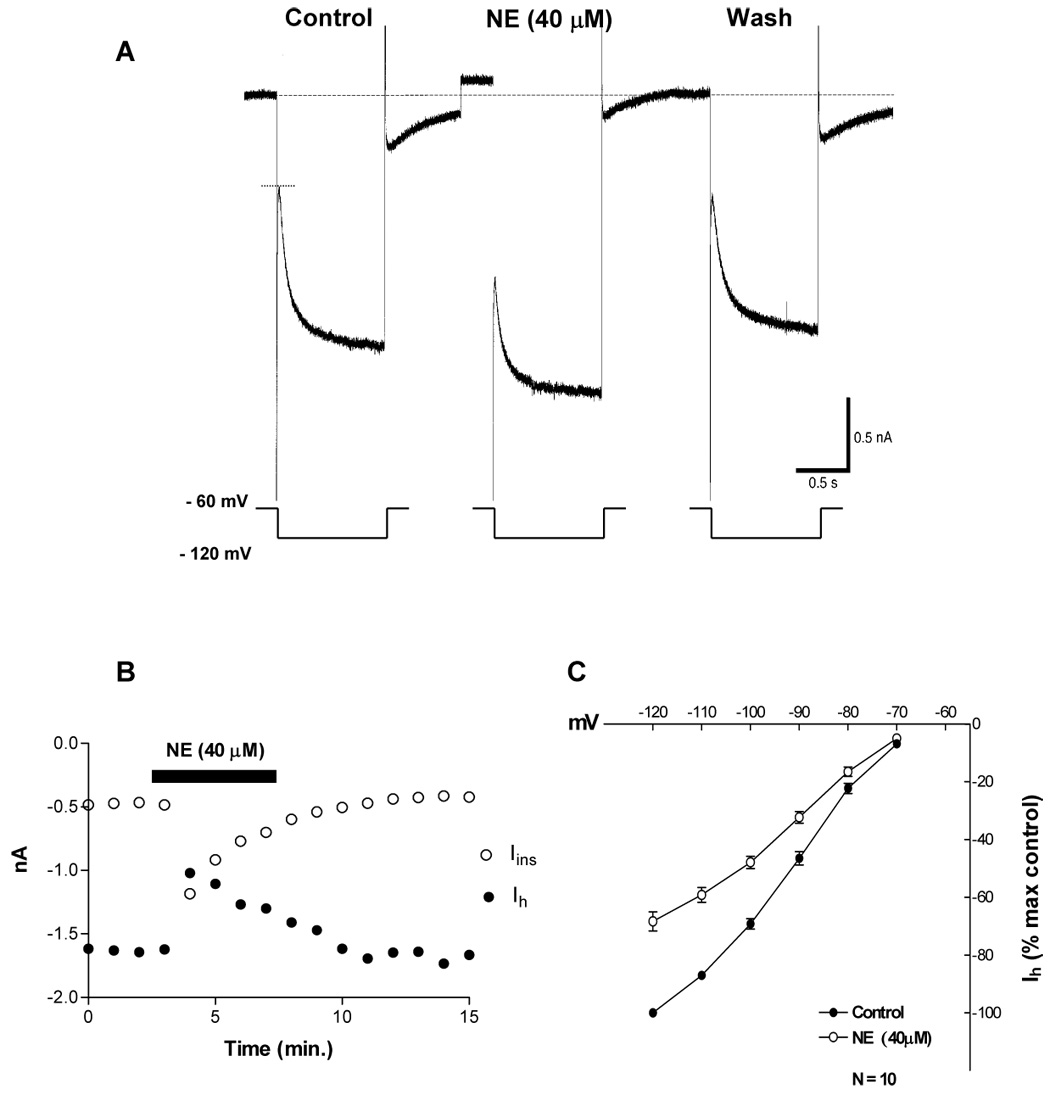
A. Voltage clamp recording showing the current response of a VTA DA cell when held at − 60 mV and commanded to − 120 mV for 1 second. Bath application of NE (2 min.) induced an outward current of 96 pA (change in holding current), a 1.7-fold increase in membrane conductance and a 30% reduction in Ih amplitude. The membrane conductance was calculated from the amplitude of the instantaneous current (between …. and ----).
B. The time course of Ih inhibition is parallel to that of the NE-induced increase in membrane conductance (increase in instantaneous current (Iins) amplitude). The data used to plot the graph is from a recording similar to the one shown in part A.
C. NE significantly reduced Ih amplitude (2-way ANOVA, F= 249, df = 1, 108; P < 0.0001). Data points represent average ± s.e.m. of ten cells.