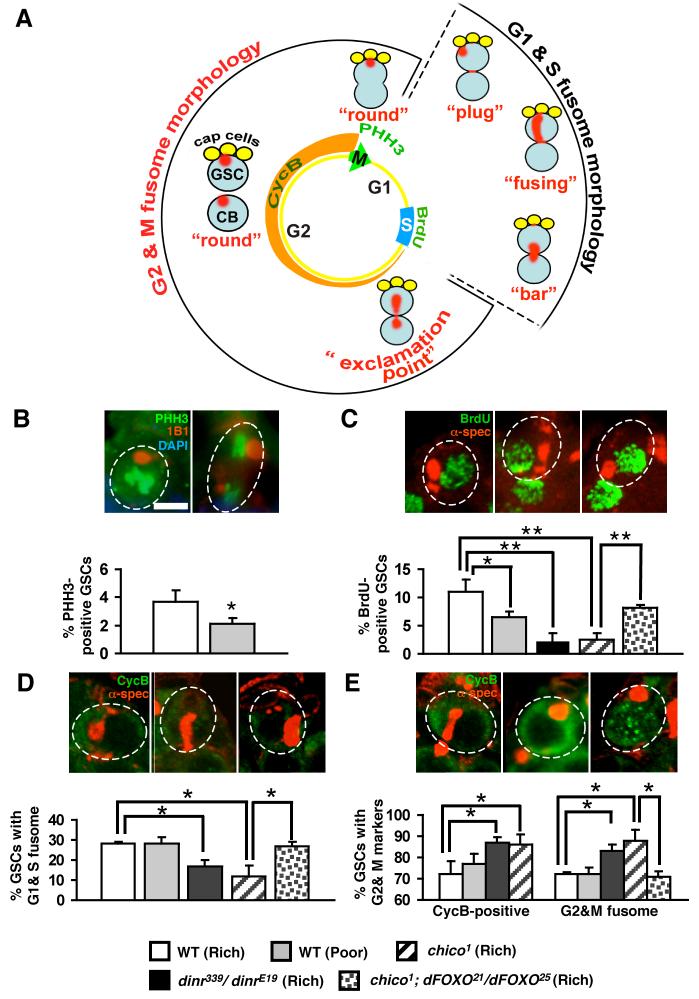
Figure 4. Diet controls the rate of GSC division via both the G1 and G2 phases of the cell cycle, but the insulin pathway specifically affects G2.
(A) Cell cycle markers and fusome morphology used to analyze the cell cycle of GSCs. PHH3 and BrdU incorporation are markers for the M and S phases, respectively. CycB is a G2 and M marker. GSC fusomes are juxtaposed to cap cells and change their morphology during the cell cycle (de Cuevas and Spradling, 1998). During M, the GSC fusome has a “round” morphology. After M, the newly formed cystoblast remains attached to the GSC by a ring canal. During G1 and S phases of the next division cycle, the GSC fusome changes its morphology to “plug”, “fusing” and “bar” as a new fusome structure or plug is assembled, fused to the old fusome and partitioned between the GSC and connected cystoblast (CB). During early G2, the GSC fusome has an “exclamation point” morphology, as the connection between the GSC and the cystoblast is severed. Later in G2, the GSC fusome becomes “round” again. (B) The frequency of GSCs in M, detected by the presence of PHH3 (green), is lower on a poor diet compared to that on a rich diet. PHH3 label co-localizes with DAPI-labeled DNA (blue), and 1B1 (red) labels fusomes. (C) The percentage of GSCs in S phase, which are labeled with BrdU (green), is also reduced under a poor diet or low insulin signaling. In chico; dFOXO double mutants, the frequency of BrdU-positive GSCs is significantly increased relative to that of chico mutants. α-spectrin (red) labels fusomes. (D) The percentage of GSCs with a “G1&S” fusome morphology is similar in wild-type females under rich and poor diets, but it is reduced in dinr and chico mutant flies. This reduction is reversed in chico; dFOXO double mutants. (E) The percentage of GSCs displaying “G2&M” fusome morphology or CycB expression does not change in response to diet, but is higher in dinr and chico mutants. This increase is reversed in chico; dFOXO double mutants. In D, E, CycB (green) and α-spectrin (red) are shown. CycB-negative and -positive GSCs are shown in D and E, respectively. GSCs are outlined by dashed ovals. All images are shown at the same magnification. Scale bar, 5 μm. Bars in graphs show standard deviation. Single asterisks, P<0.05. Double asterisk, P<0.001.

