
Figure 3.
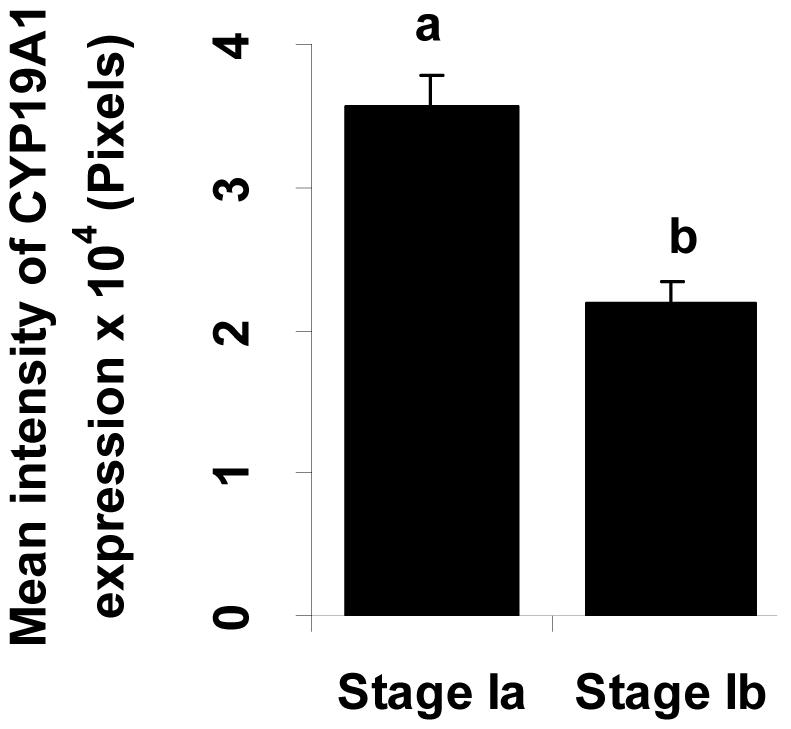
Intensity of CYP19A1 expression at early stage I (stage Ia) to mid stage I (Stage Ib) in the oocytes. Expressed regions were analyzed by means of KODAK 1D image Analysis Software (Creating regions of interest, ROIs). Bars with different letters are statistically different (p<0.05). Each bar represents the mean ± S.E. from 3-5 oocytes per developmental stage (stage Ia and Ib) from 5 fish.