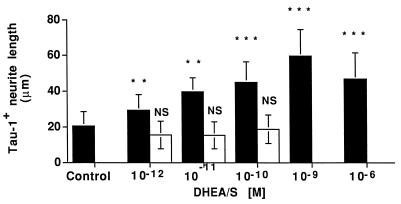
Figure 3.
Dose dependent effect of DHEA on Tau-1+ neurite outgrowth. Each column shows the mean length of Tau-1+ neurites for at least 100 labeled neurons/condition from three separate wells in one representative experiment. Solid bars are DHEA treatment and open bars are DHEAS treatment. Error bars are ±SD. Neurite length was quantitated by using the nih image 1.57 program. Statistical differences were determined by using a one-way ANOVA with a post hoc Scheffe’s analysis; ∗∗∗, P < 0.0001; ∗∗, P < 0.001. Three independent experiments gave similar results.

