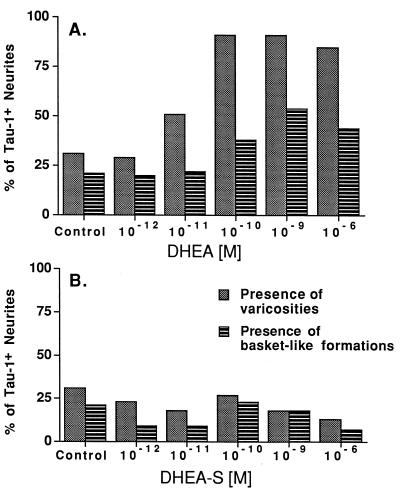
Figure 4.
Effect of DHEA (A) and DHEAS (B) on varicosities and basket-like formations on Tau-1+ neurites. The histograms express a single percentage of all neurons sampled. Gray bars are the percentage of Tau-1+ neurites bearing one or more varicosities; hatched bars are the percentage of Tau-1+ neurites making basket-like formations around cultured neurons. Data were analyzed by χ2 analysis. For DHEA treatment, χ2 = 131.4; P < 0.0001 for frequency of varicosities and χ2 = 30.3; P < 0.0001 for frequency of basket-like formations. The presence of varicosities and of basket-like formations is independent of each dose of DHEAS treatment (χ2 = 3.8; P < 0.567 for frequency of varicosities and χ2 = 4.7; P < 0.446 for frequency of basket-like formations).

