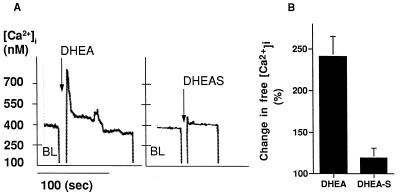
Figure 5.
DHEA increases [Ca2+]i measured by microfluorometry on a suspension of the cells preloaded with Indo-1. (A) shows a typical response of cells incubated with 10−12 M DHEA. Fluorescence was measured continuously for 3 min immediately following injection of the steroid. (B) Quantitation of peak [Ca2+]i was determined after calibration of the dye. There was a linear correlation between the values of the baseline and the values of the DHEA induced peak and plateau (peak: r2 = 0.879, P = 0.021; plateau: r2 = 0.977, P = 0.008), allowing us to correct peak and plateau values obtained in different experiments with respect to the baseline values. Therefore, we standardized the [Ca2+] for each experiment placing the baseline arbitrarily at 100% and presented the mean quantitative values (solid bars) as percent of variation of the peak value from the baseline. Error bars are ±SEM of the standardized [Ca2+] from at least three experiments, each performed in duplicate.

