Figure 2.
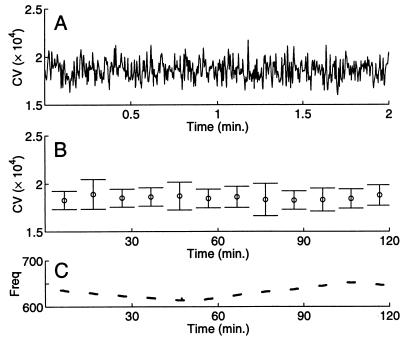
EOD coefficient of variation can remain constant over short and long time scales. (A) Two-minute continuous recording of EOD intervals (magnified from fourth data segment in B) yields a consistent CV value. (B) Two of every 10 min were recorded for 2 hr (mean ± SD of CV values are plotted). EOD CV remained largely constant over this long time period. Although the CV may briefly increase by 20–100%, it does not drop below a minimum value. The three largest error bars are associated with data segments containing large EOD excursions called chirps. (C) Frequency changes over the 2 hr were independent of CV value, and occurred primarily because of water temperature changes. Window length: 200 cycles.

