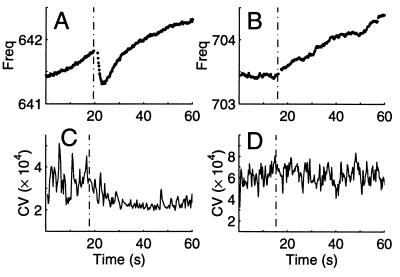
Figure 7.
Stimulus-dependent changes in EOD frequency (stimulus onset marked by dashed vertical line). (A) Typical frequency response to a tap on the fish’s tank. This temporary drop in frequency and rapid recovery also was observed after other stimuli (water drop). (B) Typical frequency response to light touch is a reversal of frequency slope, in this case switching from constant to rising EOD frequency. (C) Characteristic decrease in the CV of the EOD after a tap to the tank. Example is from the same stimulus type as in A but a different trial. (D) After touching the tail, the CV of the EOD did not change. Example is same stimulus type as for B but a different trial. Window length: 200 cycles.

